Your Weekly Reports Build Themselves
AI agent that analyses and creates interactive dashboards from Google Sheets, Excel, or databases—in minutes.


 Google Sheets
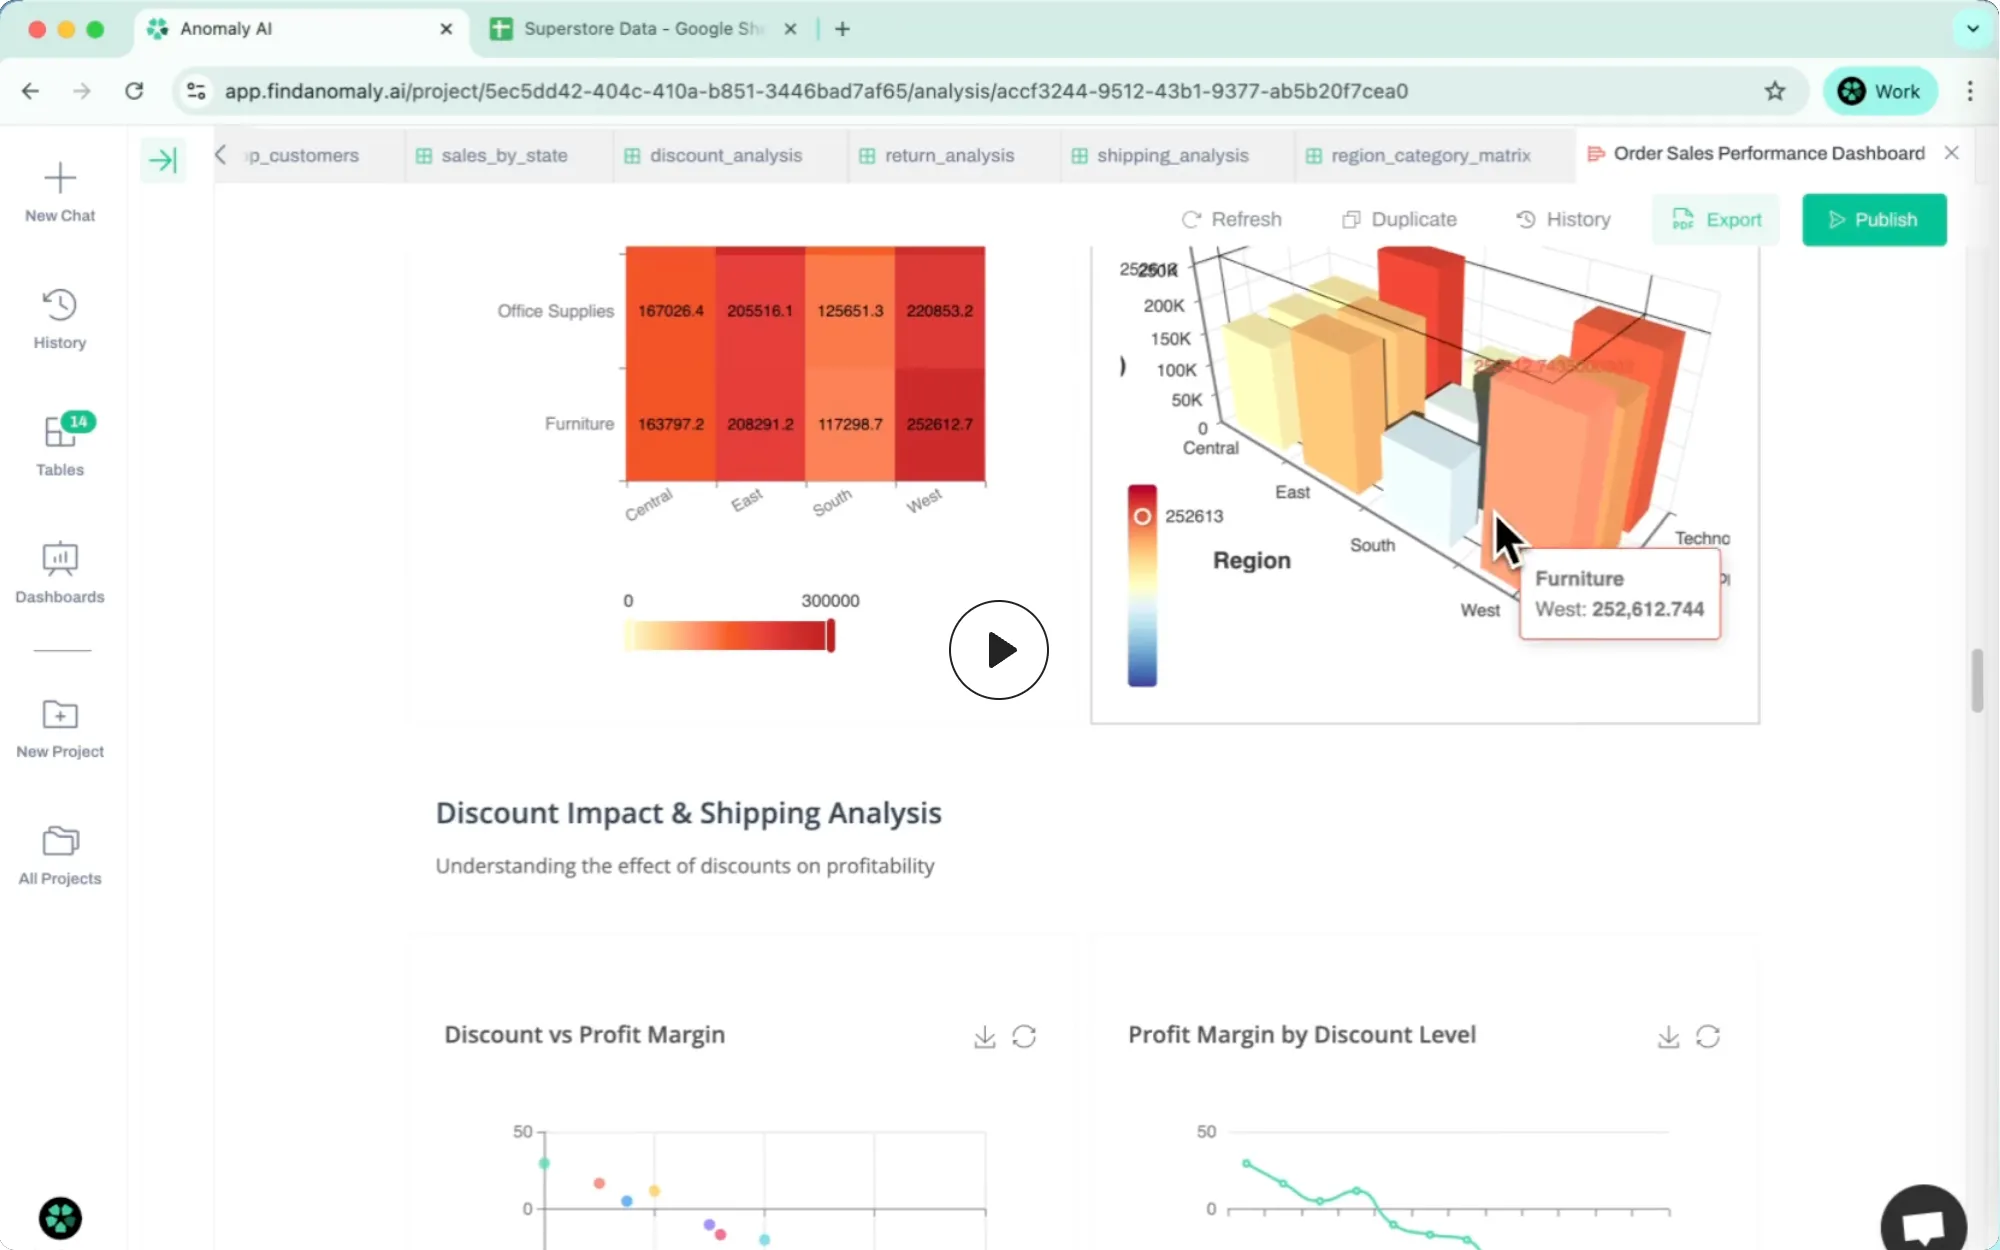
Works With Your Data Sources
Upload spreadsheets or connect to your databases - Anomaly AI transforms any data source into interactive dashboards
How It Works
From raw data to interactive dashboards in minutes. Every step is automated, every metric is verifiable.
Connect your spreadsheets and databases
Upload Excel, CSV files or connect SQL databases with ease. Our platform handles millions of rows with enterprise-grade security, automatic file validation, and intelligent data type detection.
AI automatically prepares your data
Our advanced AI agents automatically scan your data to identify quality issues, inconsistencies, and anomalies. They intelligently remove duplicates, standardize date formats, normalize text fields, handle missing values, and detect outliers.
Transform raw data into business insights
Our AI engine analyzes your clean data to discover patterns, relationships, and key business metrics. It automatically creates optimized data models, calculates relevant KPIs, identifies trends and correlations, and generates statistical summaries.
Generate shareable interactive dashboards
Generate beautiful, interactive dashboards that tell your data's story. Share with your team and collaborate in real-time. Our dashboards feature drill-down capabilities, real-time filtering, responsive design for all devices, and easy sharing options.
Use Cases
Transform your data into actionable insights across every department. From sales performance to financial reporting, our AI-powered dashboards deliver the metrics that matter most to your team.
Sales & Marketing
Track revenue performance, conversion rates, campaign ROI, lead generation metrics, and customer acquisition costs with real-time dashboards.
Finance & Accounting
Monitor P&L statements, cash flow analysis, budget variance, expense tracking, and financial KPIs with automated reporting.
Product Management
Analyze user engagement, feature adoption, product performance metrics, A/B test results, and customer feedback data.
Human Resources
Track employee performance, retention rates, recruitment metrics, training effectiveness, and workforce analytics.
Energy & Utilities
Monitor energy consumption, cost optimization, sustainability metrics, equipment performance, and operational efficiency.
Risk & Compliance
Track compliance metrics, risk assessments, audit trails, regulatory reporting, and security performance indicators.
Ready to transform your data?
Get started with your custom AI-powered dashboards today. Whether you need help with setup or have questions about our platform, we're here to help.
